HL Savings & Resilience Barometer – July 2024
Foreword
Lucy Thomas, Director of Corporate Affairs, Hargreaves Lansdown
We are delighted to share the results from the July 2024 edition of HL’s Savings & Resilience Barometer, the sixth edition of our unique analysis of the state of the UK’s financial resilience to understand just how prepared we are as a nation for our financial futures.
At HL we make it easy to save and invest for a better future, and this report makes clear that there is still some way to go to ensure that people are given the tools and understanding to make the best decisions to secure their financial future.
In the latest research, I was particularly struck by the contrast between short and long term resilience that has developed as we have navigated lockdown and the subsequent cost of living crisis. Cash savings have grown on average irrespective of income level while pension savings, relative to target savings, have declined. This is something that we are particularly passionate about at HL, as the UK faces a worrying future with just 17.8% forecast in our latest data to have adequate savings for a comfortable retirement, and 38% having provision for a moderate income in retirement. This is something that we are on a mission to help solve.
To this end HL provides a significant amount of information about savings and investment on our website. Our easy to understand guides help people navigate often complex decisions with implications for tax and income in retirement. Our financial advice service goes one step further providing solutions for individuals. We are constantly improving our client journeys to assist with decision making and are working with the FCA to adapt the regulatory framework so that we are able to personalise information for more of our clients outside of full financial advice.
As the new Government sets out its plans for office, this work acts as a clear reminder of the need to think of our household finances in the round. It is not enough to focus only on short term resilience when we also need to have put money aside for later life and a time after work. Government resources are limited meaning it is more important than ever for the financial services sector to evolve, embrace new regulation and deliver improved money management for the nation. The new ministerial appointment covering pensions in both the Department for Work and Pensions and HM Treasury is a positive step in the right direction for the holistic thinking needed on this issue.
The latest Barometer shows clearly that whilst almost all pockets of society have potential to boost their financial resilience, some groups are lagging far more than others. This report examines single households, renters, mortgage holders and regional differences, but it is the self-employed that really stands out to me. This group take on greater uncertainty in the working lives and this is showing in their ability to build financial resilience. The plight of this group is why Hargreaves Lansdown has specifically built content to help those working for themselves and championed reform of the Lifetime ISA to make it an even better, even more appropriate saving and investing option for the self-employed.
With such clear findings and trends over our 10 different reports on financial resilience, including deep dives on auto-enrolment, the self-employed, re-mortgaging and the efficient use of money, while some clear issues persist, there are reasons for optimism as we can work together across industry, government and regulators to make a big difference.
Executive summary
Levels of savings have had the biggest impact on financial resilience as it has ebbed and flowed since the start of the decade.
The Savings and Resilience Barometer score sits at 61.1 in 2024 Q2, up 3.9 points on its pre-pandemic level. The headline score today is 1.2 points above the low that was seen coming out of the cost-of-living crisis but remains 1.8 points below its pandemic period high of 62.9. This improvement has predominantly been driven by the high savings rates―the amount of money households save as a percentage of their disposable income¬―seen since the pandemic. In 2024 Q2, the savings rate is expected to stand at 9.2%, 4.1 percentage points above the 2019 average. This has led to a 14.7 point increase in the ‘Saving for a rainy day’ pillar since the pre-pandemic period. Despite this, recent research by Hargreaves Lansdown and Oxford Economics1 shows that households can boost their resilience further by using these savings more efficiently.
Fig. 1. How national financial resilience has evolved from pre-pandemic2 to 2024 Q2
Change in home ownerhsip indicator scores, 2025 Q2 vs 2024 Q2
Source: Oxford Economics
The improvements in the headline Barometer score masks significant variation in financial resilience across Great Britain.
With a new government in place, this report reviews the current financial resilience of households across a range of different cohorts―family type, tenure status, location and employment status. This acts as an overview to help the new government better understand the financial resilience challenges faced by households across Great Britain in 2024.
Whilst short term savings have risen, planning for later life has fallen back, there’s plenty of opportunity to address this short fall with better money management
This is particularly stark when exploring the indicators relating to liquid assets, i.e. cash and that reflecting the value of the pension. Our report in April 2024 on efficient money use explored in more detail how households could be in a position to improve their financial resilience with better allocation of their resources.
Fig. 2. Gains in financial resilience since the pandemic have been unevenly distributed
Source: Oxford Economics
Single households’ financial resilience lags those in a couple, and single households with children are most vulnerable.
This is predominantly due to these households having lower incomes relative to their costs―which they are less able to share across earners. At 70.7% the proportion of single households with children that have ‘Very poor’ or ‘Poor’ financial resilience is over twice the national level. In 2024 Q2, Single households with children on average have surplus income―income in excess of expenditure―of £50 and only 26.3% have adequate levels of liquid savings to protect against a rainy day, these figures are substantially below the national levels of £235.40 and 64.6% respectively.
Among single households with a child, those that are self-employed, non-working and in the bottom income quintile have particularly low financial resilience. In each of these sub-groups more than 90% of households have ‘Poor’ or ‘Very poor’ resilience which is over three times higher than the national rate. Only 10% of single households with a child that are in the bottom income quintile have adequate liquid savings to protect for a rainy day, while the median monthly surplus income among this group is just £5. In addition, two-thirds of these households are expected to be in arrears which is significantly higher than single households with a child average (32.0%) and the national average (8.7%).
Renters continue to experience lower financial resilience, despite an improvement in their financial resilience since the pre-pandemic period.
At 54.0% the proportion of renters with ‘Very poor’ or ‘Poor’ financial resilience is over 20 percentage points above the national level, and in this group there are households with even worse scores. Almost all renters with children who are in the bottom income quintile fall into these categories. The median pension gap―the gap between the pension savings households need for a moderate income in retirement and the level of pension savings they have―in this group is £81,600, while the median household has liquid savings equivalent to less than two weeks of essential spending.
Interest rate hikes are still playing through for homeowners
The financial resilience of homeowners with a mortgage is closely linked to whether they have already remortgaged onto higher interest rates. 18% of households who had to remortgage onto higher rates between 2022 Q4 and 2024 Q2 have ‘Poor’ or ‘Very poor’ financial resilience compared to 12.6% for households who are yet to refinance. Surplus income for households who have remortgaged over this period is £315, which is £95 lower the level among households who have yet to remortgage.
While interest rates are expected to fall to 4.1% by 2025 Q2, in our higher interest rate sensitivity scenario―in which inflation remains higher for longer the base rate is 5.6% in 2025 Q2―the financial resilience of households remortgaging over the next year would be hit far harder. In the higher base rate scenario, the average household refinancing between 2024 Q3 and 2025 Q2 would see their monthly mortgage costs rise by £125 compared to £65 in our baseline scenario.
On average self-employed led households have lower financial resilience scores than households led by an employee.
Among self-employed led households 52.0% have ‘Very Poor’ or ‘Poor’ financial resilience, which is significantly higher than the proportion for employee led households. The median pension savings gap for self-employed households stands at £78,800, nearly eight times the size of the gap for employee-led households (£10,200). Despite their relatively high financial resilience at the national level, there are sub-groups of employee led households with high levels of ‘Very poor’ and ‘Poor’ resilience. Employee led households in the lowest income quintile have particularly low levels of financial resilience; the median monthly surplus income in this group is just £15 compared to the national average of £235.
Across Great Britain there is significant variation in households’ financial resilience across regions and within regions.
At a regional level financial resilience is higher in the Southeast of England and East Anglia. In these regions Kent (65.6 points) and Bedfordshire & Hertfordshire (65.7 points) perform particularly well, scoring over 4.5 points above the national average. Financial resilience tends to be lower at a regional level in the Northwest of England and in London. In these regions Merseyside (57.0 points) and Outer London South (55.9) score lowest, but there are pockets like West London (62.9 points) that perform relatively well.
Fig. 3. Variation in the Barometer score across the sub-regions of Great Britain in 2024 Q2
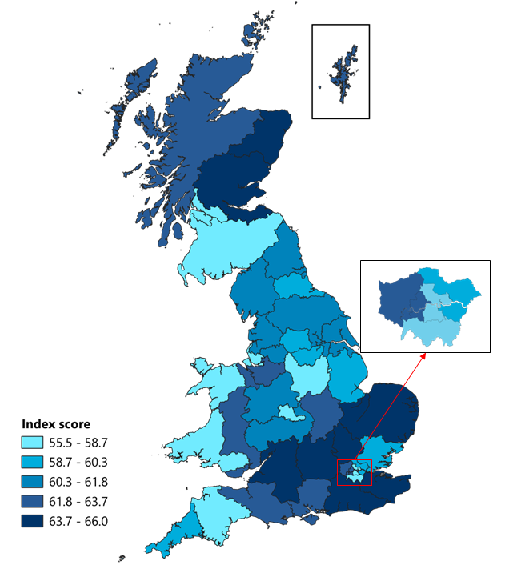
Source: Oxford Economics
Finally, household’s preparedness for retirement is hugely dependent on the costs of their needs and wants in retirement. In this edition, we have updated our approach for estimating these costs. Our updated approach increases our benchmark for a moderate income in retirement by inflation, instead of the significantly higher rates recently proposed by the Pensions and Lifetime Savings Association (PLSA). This acts to increase the cost of retirement accurately while not adding to the goods and services that are seen as necessary for a moderate retirement income. This modification leads to a ‘Value of pension’ score that is 7.2 points higher and a 10 percentage point increase in the proportion of households with adequate pensions compared to had we simply adopted the PLSA’s proposals.
Financial resilience – the current state of the nation
The headline Barometer score for Great Britain was 61.1 points in 2024 Q2, just 0.1 points below the level seen at the end of 2023. Following a recent period of recovery, the score today is 1.2 points above the low of the cost-of-living crisis but remains 1.8 points below its pandemic high of 62.9. The nation’s financial resilience has ebbed and flowed since the start of the decade, but overall resilience is up. The improvement seen during the pandemic outweighed the deterioration seen over the cost-of-living crisis, which leaves the Barometer score today 3.9 points above its pre-pandemic level (between 2018 Q2 and 2020 Q1).
Fig. 4. How national financial resilience has evolved from pre-pandemic3 to 2024 Q2
Source: Oxford Economics
Household disposable incomes have increased since the start of 2023 and household savings continue to remain at historically high levels.
Real household disposable income is expected to grow by 2.1% between 2023 Q1 and 2024 Q2, but despite this growth, it is still expected to remain below its 2019 Q4 level. The recent increase in real household disposable incomes is driven by growth in wages and government transfers outstripping falling inflation, which boosts the overall Barometer score. These conditions, combined with low consumption, have resulted in high savings rates, which further improves financial resilience across the nation. In 2024 Q2, the savings ratio is expected to stand at 9.2%, 4.1 percentage points above the 2019 average.
Fig. 5. Real household disposable income and savings ratio have increased since 2023 Q14
Source: Oxford Economics
The proportion of households categorised as having ‘Very poor’ or ‘Poor’ financial resilience has been stable over the last 6 months and remains close to the lows seen during the pandemic.
The proportion of households across Great Britain with ‘Very poor’ or ‘Poor’ financial resilience5 fell significantly over the pandemic to a low of 27.7% in 2021 Q1, before rising to 33.6% coming out of the cost-of-living crisis and sits at 30.7% today. While the proportion of households in these categories has fallen significantly since the start of the decade, the average score among households in these groups has fallen by 1.1 points. This highlights that not all households have benefitted from the overall gains in resilience seen at the national level.
Fig. 6. Fewer households have ‘Very poor’ or ‘Poor’ resilience financial resilience than during the cost-of-living crisis6
Source: Oxford Economics
The change in households scoring ‘Good’ or ‘Great’ since the pandemic period has varied significantly at the pillar level.
The ‘Saving for a rainy day’ pillar has seen its score improve by 14.7 points since the pre-pandemic period (2018 Q2 to 2020 Q1). This has caused the proportion of households categorised as ‘Good’ or ‘Great’ in this pillar to rise by 22.2 percentage points, which is the main driver of the 12.4 percentage point increase in the proportion in this band at the overall Barometer level. The significant improvement in the ‘Adequacy of liquid assets’7 and ‘Surplus income’ indicators have driven much of this overall change. On average, 64.8% of households currently have an adequate level of liquid assets compared to the pre-pandemic proportion of 47.3%. In addition, the median household is expected to be saving―surplus income―£235 per month, over twice the pre-pandemic level of £110 per month8.
The ‘Plan for later life’ pillar has seen the proportion of households categorised as ‘Good’ or ‘Great’ fall by 1.8 percentage points relative to the pre-pandemic period. This fall is partly driven the ‘Pension value’ indicator, which saw the proportion of households with adequate pension savings fall from 43.0% in the pre-pandemic period to 38.0% in 2024 Q2. The median pension gap―the gap between the pension savings households need for a moderate income in retirement and the level of pension savings they have―for households with inadequate pension savings stands at £82,000 in 2024 Q2, up over £58,0009 on the pre-pandemic level. The improvement in the ‘Control your debt’ pillar has been driven by changes in household’s mortgage to income ratio―though this is expected to unwind as households continue to move onto new higher rate fixed mortgages―and with an increase in the proportion of households opting for fixed term mortgages10.
Fig. 7. Gains seen primarily in the ‘save a penny for a rainy day’ indicator11
Percentage point change in households scoring 'Good' and 'Great' (pre-pandemic to 2024 Q2)
Source: Oxford Economics
The improvement in households scoring ‘Good’ or ‘Great’ in the ‘Save a penny for a rainy day’ pillar―relative to the pre-pandemic period―has primarily benefited above average earners. Households in the fourth to eight income deciles have seen their average ‘Adequacy of liquid assets’ score increase by over 20 points, while the lowest earners have seen an increase of just 1.3 points over this period. In the ‘Plan for later life’ pillar lower income households have seen larger falls in the ‘Value of pension’ indicator underpinned by lower average household pension contribution rates.
Fig. 8. Gains in financial resilience since the pandemic have been unevenly distributed.
Source: Oxford Economics
Financial resilience across households
With a new government in place, this section reviews the current financial resilience of households by cohort to better understand their needs for future support.
Financial resilience by family type
Single households have the lowest financial resilience and have also seen the smallest improvement in their financial resilience since 2019 Q4.
Single households with and without children had the lowest pre-pandemic (2018 Q1 to 2020 Q1) scores of 43.2 and 48.1 points, respectively, significantly below the national average of 57.2 points. Their financial resilience has increased by 2.5 and 2.4 points, respectively, since the pre-pandemic period (2018 Q2 to 2020 Q1). This is below the national average gain of 3.9 points.
Single households are the most vulnerable and those with children are under added strain.
Households with children generally have lower financial resilience across each of the five pillars, highlighting the additional financial pressures that result from supporting a family. In 2024 Q2, single households with children on average have surplus income―income in excess of expenditure12 of £50 and only 26.3% have adequate levels of liquid savings to protect against a rainy day. These figures are substantially below the national average of £235 and 64.6%, respectively.
Given this, it is not surprising that single households with children are the family cohort with the highest proportion of households with ‘Very poor’ and ‘Poor’ financial resilience, making up 70.7% of the households in these categories. Looking at their situation more closely, single households with children perform particularly poorly, relative to the national average, in the ‘Save a penny for a rainy day’ and ‘Plan for later life’ pillars. The proportion of households in this group with ‘Very poor’ and ‘Poor’ scores in these indicators are 59.5% and 76.2%; the equivalent figures at a national level are 24.1% and 41.6%, respectively. The median pension savings gap―the gap between the pension savings households need for a moderate income in retirement and the level of pension savings they have―for single households with children is £32,000, nearly £10,000 above the national average (£23,500).
Fig. 9. Single households and households with children have lower financial resilience
Source: Oxford Economics
Among the already low scoring group of single households with children, there is a large variation in financial resilience.
Among single households with children, those that are self-employed, non-working, and in the bottom income quintile have particularly low financial resilience. In each of these subgroups, more than 90% of households have ‘Poor’ or ‘Very poor’ resilience, which is over three times higher than the national rate. Only 10% of single households with children that are in the bottom income quintile have adequate liquid savings to protect for a rainy day, while the median monthly surplus income among this group is just £5. In addition, two-thirds of these households are expected to be in arrears which is significantly higher than single households with a child average (32.0%) and the national average (8.7%). Financial resilience among single female-led households with children sits around the cohort average, but this is to be expected as this group represents 90% of all single households with children.
Fig. 10. Among single households with children, some sub-groups are significantly underperforming the cohort average
Source: Oxford Economics
Financial resilience by tenure
Renters have seen financial resilience gains in line with the national average.
The financial resilience of renters has improved by 3.7 points since the pre-pandemic period, in line with the national average. However, renters have seen their ‘Arrears’ and ‘Subjective evaluation of debt position’ indicators fall by 3.5 and 10.0 points, respectively, over this period. Households who have not yet remortgaged onto higher interest rates have seen the largest increases in their financial resilience score since the start of the decade as they have―so far―benefitted from increases in income and have been shielded from increases in mortgage repayments.
Homeowners who have had to recently remortgage onto higher rates have lower financial resilience, but renters still underperform when compared to homeowners.
The proportion of households with ‘Poor’ or ‘Very poor’ financial resilience is higher among households who had to remortgage onto higher rates between 2022 Q4 and 2024 Q2 (18.0%) than for those who are yet to refinance (12.4%). Surplus income for households who have remortgaged over this period is £315, which is £95 lower than the level among households who have yet to remortgage. Despite the additional financial burden of remortgaging onto higher rates, financial resilience is better among this group than for the renters’ cohort―where 54.0% of households score ‘Very poor’ or ‘Poor’. The renter score is dragged down by the ‘Plan for later life’ indicator, with 74.7% of renting households in the ‘Very poor’ or ‘Poor’ band. The median pension gap among renters is £52,200, over twice the size of the average gap across all households.
Fig. 11. More renters are categorised as ‘Very Poor’ or ‘Poor’
Source: Oxford Economics
There are several groups of renting households that have a high proportion categorised as having ‘Very poor’ or ‘Poor’ financial resilience.
While there is a significantly higher proportion of renters with ‘Very poor’ or ‘Poor’ financial resilience than the national average, there are particular types of renters that have especially low resilience. Almost all (99.6%) renters with children who are in the bottom income quintile have ‘Very poor’ or ‘Poor’ financial resilience. The median pension gap in this group is £81,600, while the median household has liquid savings equivalent to less than two weeks of essential spending. Other groups of renters, such as those in social housing, non-working, and over 50, also see a larger proportion of households with low financial resilience.
Fig. 12. Several renting households have limited financial resilience
Source: Oxford Economics
Financial resilience by employment status
Non-working households have seen very little of the increase in financial resilience across Great Britain since the start of the decade.
Despite a 3.9-point increase in the headline Barometer score since the pre-pandemic period, the score for non-working households has only increased by 0.2 points. Self-employed households have seen a below average increase in their financial resilience score over this period; this is driven by a larger proportion of these households working in industries that saw significant disruption during the pandemic.
On average self-employed-led households have lower financial resilience scores than households led by an employee. As discussed in the Self-Employed Deep Dive13, this can largely be attributed to differences in workplace benefits. Further exploration into these households shows that 52.2% of them have ‘Very Poor’ or ‘Poor’ financial resilience, which is significantly higher than the proportion of households at a national level in these bands.
In particular, self-employed households underperform in the ‘Protect your family’ indicator, with 71.8% categorised as ‘Very poor’ or ‘Poor’ when compared to 19.1% for employees, attributed to the lack of access to sick pay. Indeed, 92% of employee households have adequate sick pay and income protection cover while only 27.7% of self-employed household have adequate coverage. Similarly, 48.9% of self-employed households are categorised as ‘Very poor’ or ‘Poor’ in the ‘Plan for later life’ pillar compared to 33.6% for employees, reflecting a pension shortfall measured by the ‘Value of Pension’ indicator. The median pension savings gap for self-employed households stands at £78,800, nearly eight times the size of the gap for employee-led households (£10,200).
Fig. 13. Employees have higher financial resilience compared to the self-employed
Source: Oxford Economics
Despite their relatively high financial resilience at the national level, there are sub-groups of employee-led households with high levels of ‘Very poor’ and ‘Poor’ resilience. As expected, employee-led households in the lowest income quintile have higher than average levels of ‘Very poor’ and ‘Poor’ resilience. The median monthly surplus income in this group is just £15 compared to the national average of £235; while less than a third (32.5%) of these households have adequate levels of liquid assets significantly lower than the national average of 64.6%. Interestingly, the proportion of employee-led households working for SMEs in these categories is also elevated. As discussed in Wave IV, this is largely underpinned by a weaker performance in ‘Plan for later life’ pillar driven by less extensive pension provision.
Fig. 14. Despite being an employee, several sub-groups in this cohort have ‘Very poor’ or ‘Poor’ financial resilience
Source: Oxford Economics
Financial resilience by region
There is significant variation in financial resilience across Great Britain.
Across Great Britain there is significant variation in financial resilience across and within regions. At a regional level, financial resilience is higher in the Southeast of England and East Anglia. In these regions, Kent (65.6 points) and Bedfordshire & Hertfordshire (65.7 points) perform particularly well, scoring over 4.5 points above the national average. Financial resilience tends to be lower at a regional level in the Northwest of England and in London. In these regions Merseyside (57.0 points) and Outer London South (55.9) score lowest, but there are pockets like West London (62.9 points) that perform relatively well.
Fig. 15. Variation in the Barometer score across the sub-regions14 of Great Britain in 2024 Q2
Source: Oxford Economics
There is significant variation in median household’s monthly surplus income and adequacy of liquid assets across the nation.
The median monthly household surplus income in Great Britain is £235; this figure hides significant regional variation. The figure for households in West London of £595 stands in stark contrast to the figure of just £85 in Southern Scotland. There is also significant variation in the adequacy of liquid assets across the regions, with 84% of households in West London having enough liquid savings to cover three months of essential expenditure, but less than half (49.8%) of households in Southern Scotland hold adequate liquid savings.
Fig. 16. Worst and best performing sub-regions monthly surplus income15
Source: Oxford Economics
We recognise that there is significant variation in financial resilience across the regions of Great Britain. This topic will be explored in greater depth in future editions of the Barometer.
Changes to the 'value of pension' indicator
The fall in the ‘Plan for later life’ indicator would have been worse without a methodological change to the ‘Value of pension’ indicator.
The ‘Value of pension’ indicator is based on households’ total pension value as a proportion of the total pension value required to be on track to fund a moderate standard of living in retirement. In the original methodology, the total pension value required was underpinned by the ‘Moderate income in retirement’16 estimate from Pension and Lifetime Savings Association’s (PLSA)―an organisation who represent pension schemes that provide retirement incomes to more than 30 million savers in the UK. This estimate was used to update the pension savings requirement in each previous iteration of the Barometer.
The PLSA’s estimate for a ‘Moderate income in retirement’ in 2023 increased significantly above the rate of inflation due to changes in its methodology17. To maintain consistency in the ‘Pension value’ score over time, the indicator is now calculated by increasing the PLSA’s estimate of a ‘Moderate income in retirement’ by headline inflation growth. However, switching to an approach based on headline inflation means that future uprating will be based on increases in the cost of the nationwide―rather than pensioner specific―representative basket of goods and services. This means that this figure will increase by 7.3% for all household in 2023, rather than the PLSA’s uplift of 26.8% for households in a couple and 34.3% for single households. This adjustment has been applied from 2023 onwards.
Fig. 17. Updated methodology for 2023 comparison
| Household type | PLSA | CPI | |
|---|---|---|---|
| Couple with moderate retirement income | 2023 | £43,000 | £36,480 |
| Annual change, % | 26.8% | 7.3% | |
| Single with moderate retirement income | 2023 | £31,300 | £25,000 |
| Annual change, % | 34.3% | 7.3% |
Source: Oxford Economics
Applying the PLSA’s increase would lead to substantial falls in the scores for the ‘Plan for later life’ pillar and the overall Barometer.
The new approach sees the ‘Value of pension’ score remain broadly stable across 2023 at around 54 points. The stability in this score balances above target inflation over this period―which weighs on this score―against strong performance in global equity markets and a sizeable increase in the state pension. If the approach had not been adjusted and the indicator continued to be based on the PLSA’s estimate for a ‘Moderate income in retirement’, the ‘Value of pension’ score would be 7.2 points below its current level and the proportion of households with adequate pensions would have been nearly 10 percentage points lower. The lower indicator score would have reduced the ‘Plan for later life’ pillar score by 3.6 points and the overall Barometer score by 0.8 points.
Fig. 18. Methodology change leads to a smaller decline in the value of pension score18
Source: Oxford Economics
Outlook for the next 12 months
Household disposable income growth is expected to gradually improve over the next 12 months, but it is still expected to remain just below 2019 Q4 levels in mid-2025.
Macroeconomic conditions are expected to continue to stabilise over the next 12 months, meaning the economic outlook for households is brighter than it has been in recent years. In Oxford Economics’ baseline forecast, real household disposable income is expected to increase by 0.7% from 2024 Q2 to 2025 Q2. This is driven by nominal wage growth exceeding inflation which is partly attributable to increases in the national living wage. Despite this growth, real household incomes at the end of 2025 will be 0.1% below the levels seen in 2019 Q4; in contrast, this figure grew by 8.9%19 in the five and a half years leading up to 2019 Q4. Growth in real consumption is expected to continue to remain subdued, resulting in a savings rate of that is around 3.5 percentage points above its pre-pandemic level over this period.
Fig. 19. The growth of real household disposable income is projected to continue to improve
Source: Oxford Economics
Headline inflation has returned to 2% and nominal weekly earnings growth is forecast to continue to slow, enabling interest rates to be reduced.
The headline rate of CPI has returned to the Bank of England’s two percent target faster than expected in December 2023. The improved inflation outlook has shifted expectation towards a marginally quicker easing of the Bank of England’s base rate, which is now expected to sit at 4.1% in 2025 Q2. Nominal weekly earnings growth is expected to remain above inflation over the forecast period, though the gap is expected to narrow in the first half of 2025.
Fig. 20. Interest rates expected to fall as inflationary pressure subsides
Source: Oxford Economics
Household financial resilience is expected to stabilise as the economy recovers.
Reflecting the economic outlook, the forecast for the headline Barometer score is expected to be relatively stable over the next 12 months. The score is expected to sit at 61.2 in 2025 Q2, similar to the level seen at present. However, this stability conceals variation across indicators over the forecast period. The ‘Adequacy of liquid assets’ indicator is forecast to see an improvement of 2.0 points over the next year, driven by a continuation of historically high savings rates. As a result, 67.3% of households are expected to see adequate liquid assets savings, up by 2.7 percentage points. In contrast, the ‘Affordability of future debt repayments’ (-0.5 points) and ’Home ownership’ (-1.1 points) indicators are both expected to deteriorate, driven by the higher costs faced by remortgaging homeowners and subdued house price growth, respectively.
Fig. 21. A more stable outlook is expected
Source: Oxford Economics
The outlook for financial resilience over the next year will be influenced by the path for the Bank of England’s base rate.
In addition to the central forecast, this report explores the financial resilience implications of interest rates staying higher for longer. In this scenario, the base rate remains at its current level of 5.25% through to 2025 Q2, and this in turn leads to a 1.5% fall in house prices over the forecast period.
Fig. 22. Higher interest rates for longer impact house prices and financial markets
Source: Oxford Economics
Households refinancing between 2024 Q3 and 2025 Q2 are particularly exposed to the risk of interest rates staying higher for longer.
In the central forecast, households refinancing over the next 12 months will on average see a 1.8-point deterioration in their ‘Affordability of future debt’ indicator score. However, this fall would be significantly larger―at 4.4-points―in the higher for longer interest rate scenario. The impact on these households’ ‘Affordability of future debt’ scores is not evenly distributed, with younger households―who generally have less equity relative to the value of their home―are more exposed. Relative to the central forecast, the higher interest rates scenario would reduce the ‘Affordability of future debt’ score for 20 to 29-year-old households who are refinancing by 4.3 points, but only 0.6 points for those 60 and over. In the baseline, households aged 20 to 29 are expected to see an average monthly increase of £100 in their mortgage costs. This is higher compared to the average increase of £65 for households refinancing during the same period. In the scenario, the average increase for 20 to 29-year-old households rises to £170, while the average for households refinancing during the same period reaches £125.
Fig. 23. Households refinancing between 2024 Q3 and 2025 Q2 will see their ‘Affordability of future debt’ indicator score fall
Change in affordability of future debt indicator scores, 2025 Q2 vs 2024 Q2, for households refinancing over this period
Source: Oxford Economics
The ‘Home ownership’ indicator will also deteriorate further in the higher interest rate scenario as house prices decline, and this is also expected to hit younger households harder.
In this scenario, the ‘Home ownership indicator’ is expected to fall by 1.7 points at the end of the forecast period, 0.6 points below the score based on the central forecast. This is driven by the 1.5% fall in house prices seen in the higher interest rates for longer scenario. Again, it is younger households―whose home equity is more exposed to fluctuations in house prices―that will be most affected. The indicator score for households aged 30-39 is expected to fall by 2.5 points in the scenario compared to just 1.1 points for households aged 60 and over.
Fig. 24. The fall in the homeownership indicator is worse in this scenario
Change in home ownerhsip indicator scores, 2025 Q2 vs 2024 Q2
Source: Oxford Economics
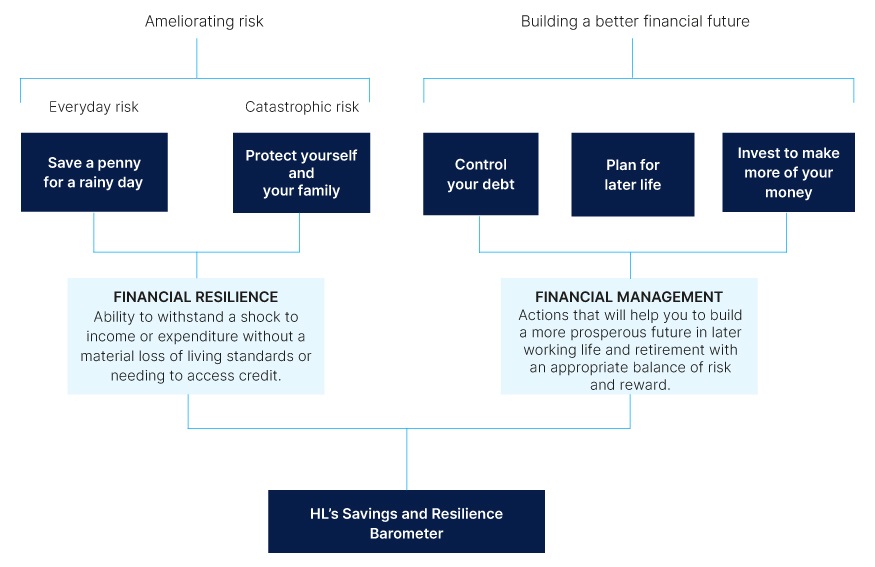
About the barometer
The Savings and Financial Resilience Barometer is an index measure designed and produced by Oxford Economics. It is based around Hargreaves Lansdown’s five building blocks for financial resilience depicted in Fig. 25. The aim of the Barometer is to provide a holistic measure of the state of the nation’s finances, monitoring to what extent households are prudently balancing current and future demands whilst guarding against alternative types of risk.
Fig. 25. Savings and Resilience Barometer: conceptual structure
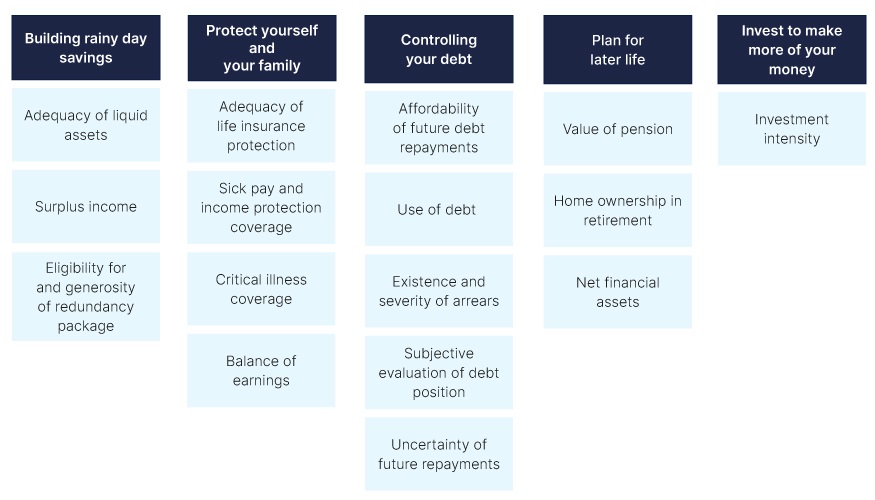
In collaboration with Hargreaves Lansdown, Oxford Economics mapped each of these pillars to a list of 16 individual indicators (Fig. 26). The data underpinning the indicators are sourced from a household panel dataset for a representative group of British households developed by linking together official datasets. The Wealth and Assets Survey (WAS), published by the ONS, has been used as the core dataset due to the breadth of financial data available in the survey. This source does not include every variable required to measure the factors, and the latest survey only extends as far as 2020 Q1. Therefore, we have used a range of methods, including econometric analysis to build upon the core dataset using data from the Financial Lives Survey (FLS), Living Costs and Food Survey (LCFS), and the Labour Force Survey (LFS).
For each indicator, the data were used to create an index value on a scale between zero and 100 for households in the panel. In each case, a score of 100 was assigned to households who had reached a specified resilience threshold e.g., holding liquid assets equivalent to at least three months of essential expenditure. Households whose savings are sufficient to cover more than three months of spending are, therefore, not rewarded for this additional level of security. Such a design is appropriate to capture the concept of resilience and the intrinsic trade-offs involved in financial management. Threshold values are defined with reference to benchmark recommendations where available and, where not, using the statistical distribution of values within the dataset and the judgement of the research working group.
Fig. 26. Savings and Resilience Barometer: Barometer Indicators
To bring the dataset up to date, values have been extrapolated through to 2023Q2 using a wide range of macroeconomic and survey data and different modelling techniques. A much more detailed description of the approach can be found in the methodology report available on the project’s landing page20. Finally, current and future values are projected based on Oxford Economics’ baseline forecast for the UK economy from its Global Economic Model (GEM).
To aid the communication of the barometer results, we have designed a method to allocate households between five bands according to their barometer scores. These bands are labelled as: very poor, poor, fair, good, and great. We will use the share of households in each band as a reference point to communicate the changing state of financial resilience in the UK.
The bands are primarily based on the quintile distribution of pre-pandemic barometer scores. The pre-pandemic distribution of ‘Control your debt’, ‘Invest to make more of your money’ and to a lesser extent ‘Protect Yourself and Your Family’ have been adjusted to take account of the nonlinear distribution of scores. Threshold scores for each band are fixed to values observed in the pre-pandemic (2019) period so that changes in the shares can be used to trace developments over time.
Fig. 27. Score range and pre-pandemic (2018Q1-2020Q1) proportion of households
Score range |
||||||
|---|---|---|---|---|---|---|
| Band | Save a penny for a rainy day |
Protect Yourself and Your Family |
Control Your Debt |
Plan for Later Life |
Invest | Overall Index |
| Very poor | 0-28 | 0-42 | 0-54 | 0-8 | 0 | 0-42 |
| Poor | 28-50 | 42-67 | 54-66 | 8-36 | 1-19 | 42-55 |
| Fair | 50-72 | 67-76 | 66-78 | 36-61 | 19-52 | 55-65 |
| Good | 72-89 | 76-88 | 78-95 | 61-79 | 52-82 | 65-74 |
| Great | 89-100 | 88-100 | 95-100 | 79-100 | 82-100 | 74-100 |
Pre-pandemic proportion of households |
||||||
|---|---|---|---|---|---|---|
| Band | Save a penny for a rainy day |
Protect Yourself and Your Family |
Control Your Debt |
Plan for Later Life |
Invest | Overall Index |
| Very poor | 20 | 17 | 19 | 20 | 55 | 20 |
| Poor | 20 | 18 | 19 | 20 | 11 | 20 |
| Fair | 20 | 26 | 19 | 20 | 11 | 20 |
| Good | 20 | 20 | 19 | 20 | 11 | 20 |
| Great | 20 | 20 | 25 | 20 | 11 | 20 |
Methodology changes
The January 2024 edition has incorporated information on changes in households’ asset allocation and the number of new investors leveraging insights from the latest Financial Lives Survey (FLS). These insights have enabled us to extrapolate the ‘Invest to make more of your money’ pillar for the first time. An overview of the methodology is found below with more details included in the methodology document.
Establishing which households are new investors
The FLS indicates that the share of adults holding an investment product increased from 32% to 37% between 2020 and 2022 and Oxford Economics have incorporated this increase in investors in the Barometer dataset. This has been estimated in three stages.
Firstly, we used a logistic regression to estimate the likelihood a respondent in the FLS was an investor in 2020 and 2022 using a model for each period. Characteristics used include personal income, age, tenure, household type, and employment status. These models are then used to estimate the likelihood of an individual being an investor in the barometer dataset. These individual likelihoods are averaged to the household level based on the individuals' income as weights.
We then ranked non-investing households by the change in likelihood between 2022 and 2020 and assumed the households with the largest increases in the likelihood were the ones that started investing. As there are differences between the proportion of investors in the FLS and WAS, we have assumed the same proportion of non-investors become investors and there are the same number of investors per household as seen in the WAS. This leads to 3.8% more households investing in the underlying dataset rising from 29.6% to 33.5%.
Finally, we extrapolate the increase in investing households between 2020Q2 and 2022Q215. We randomly select those households who have been identified as most likely to become an investor and equally distribute them as becoming an investor during one of these quarters. When a household becomes an investor, we redistribute their liquid assets to start investing in financial products. Based on the analysis of the FLS, we estimate that on average new investors have a smaller proportion of their assets in financial products. Reflecting this difference, the proportion of wealth held in each financial product is 80% less than the average seen in the underlying WAS dataset.
Estimating the change in households’ asset allocation
We have also developed models to estimate the change in the amount of investment products households hold as a share of their total asset allocation. For this analysis, we followed a similar approach to the new investors model. Using the FLS survey, we developed two OLS regression models to predict the share of assets held as investment products for 2020 and 2022. Characteristics used in the model include personal income, age, tenure, household type, and employment status.
We then used these models to establish the predicted change in this share between 2020 and 2022 for those households who were investors in the WAS. We then applied this change to the asset allocations of those households equally between the periods 2020Q2 and 2022Q2.
ABOUT OXFORD ECONOMICS
Oxford Economics was founded in 1981 as a commercial venture with Oxford University’s business college to provide economic forecasting and modelling to UK companies and financial institutions expanding abroad. Since then, we have become one of the world’s foremost independent global advisory firms, providing reports, forecasts and analytical tools on more than 200 countries, 100 industries, and 7,000 cities and regions. Our best-in-class global economic and industry models and analytical tools give us an unparalleled ability to forecast external market trends and assess their economic, social and business impact.
Headquartered in Oxford, England, with regional centres in New York, London, Frankfurt, and Singapore, Oxford Economics has offices across the globe in Belfast, Boston, Cape Town, Chicago, Dubai, Dublin, Hong Kong, Los Angeles, Mexico City, Milan, Paris, Philadelphia, Stockholm, Sydney, Tokyo, and Toronto. We employ 450 staff, including more than 300 professional economists, industry experts, and business editors—one of the largest teams of macroeconomists and thought leadership specialists. Our global team is highly skilled in a full range of research techniques and thought leadership capabilities from econometric modelling, scenario framing, and economic impact analysis to market surveys, case studies, expert panels, and web analytics.
Oxford Economics is a key adviser to corporate, financial and government decision-makers and thought leaders. Our worldwide client base now comprises over 2,000 international organisations, including leading multinational companies and financial institutions; key government bodies and trade associations; and top universities, consultancies, and think tanks.
January 2024
All data shown in tables and charts are Oxford Economics’ own data, except where otherwise stated and cited in footnotes, and are copyright © Oxford Economics Ltd.
The modelling and results presented here are based on information provided by third parties, upon which Oxford Economics has relied in producing its report and forecasts in good faith. Any subsequent revision or update of those data will affect the assessments and projections shown.
To discuss the report further please contact:
Henry Worthington:hworthington@oxfordeconomics.com
Oxford Economics
4 Millbank, London SW1P 3JA, UK
Tel: +44 203 910 8061
2 Pre-pandemic data based on the 7th wave of the Wealth and Asset Survey from 2018 Q2 to 2020Q1.
3 Pre-pandemic data based on the 7th wave of the Wealth and Asset Survey from 2018 Q2 to 2020 Q1.
4 Savings ratio calculated as household disposable income minus household consumption divided by household disposable income. This may differ from other measures of savings ratios which can include non-household specific indicators.
5 These bands are set based on the quintile distribution of pre-pandemic barometer scores.
6 Pre-pandemic data based on the 7th wave of the Wealth and Asset Survey from 2018 Q2 to 2020 Q1.
7 Sufficient liquid assets to cover three months of essential expenditure.
8 Figure is in 2024 Q2 values and adjusted for inflation using an income deflator.
9 Figure is in 2024 Q2 values and adjusted for inflation using a CPI deflator.
10 Based on the published secure loan data from the Bank of England.
11 Overall index categorisation based on the overall Barometer score and not an average of the pillar proportions.
12 Surplus income figures rounded to the nearest £5.
13 Self-Employed Financial Resilience September 2023
14 Sub-regions based on the NUTS2 regional classification.
15 Rounded to the nearest £5
16 It should be noted that not everyone should be aiming for a moderate standard of living pension saving. The minimum standard of living published by the PLSA is largely covered by the state pension in 2022, and the PSLA estimate that the minimum needed for a single household is £14,400 while this is £22,400 if in a couple. As a result, the state pension will fully cover the cost for a household with a couple and mostly cover the cost for a single individual.
17 This update was based on adding new categories of spending such as gifting money to family members and meals out being added to the PLSA’s estimate of the moderate income in retirement.
18 As the data are smoothed between years, the 2022 data are impacted by the methodological change.
19 Change in real disposable income between Q2 2014 and Q4 2019.
20 https://www.hl.co.uk/features/5-to-thrive/savings-and-resilience-comparison-tool